Super Bowl Twitter Fun Analysis

In this post we will analyze tweets related to the upcoming 2021 Super Bowl LV matchup between the Kansas City Chiefs and the Tampa Bay Buccaneers using awesome visualizations to extract insights. Social media content provides the opportunity to study an unfathomably wide range of topics. Twitter has emerged as a key data source to tap into the public conversation and discover insights. However, it is a challenge to extract insights from social media data.
Twitter is a gold mine of data. It boasts approximately 500 million tweets per day. To put that in perspective, it is on average 6,000 tweets every second. In the time it took you to read this, tens of thousands of new tweets were posted.
Twitter reveals the beating heart of the world and what is happening in it. Social media is a regular part of life for millions of people in the US where 1 in 5 adults use Twitter. They may share their opinions, thoughts, and feelings on every aspect of life. Many rely on Twitter as a news source and often emerging events are initially reported by participants and observers rather than traditional news sources.
Let’s see what people have to say about the Super Bowl on Twitter. Grab a snack and get comfortable.
Twitter Super Bowl Data
For this post we pulled all tweets for approximately 8 days from 1/26/2021 to 2/3/2021 containing the search terms ‘superbowl’ or ‘super bowl’ either in the text or as a hashtag. Only tweets in the English language were included with retweets, replies, and duplicates excluded. There were 105,199 tweets that met our criteria from 66,993 unique users.
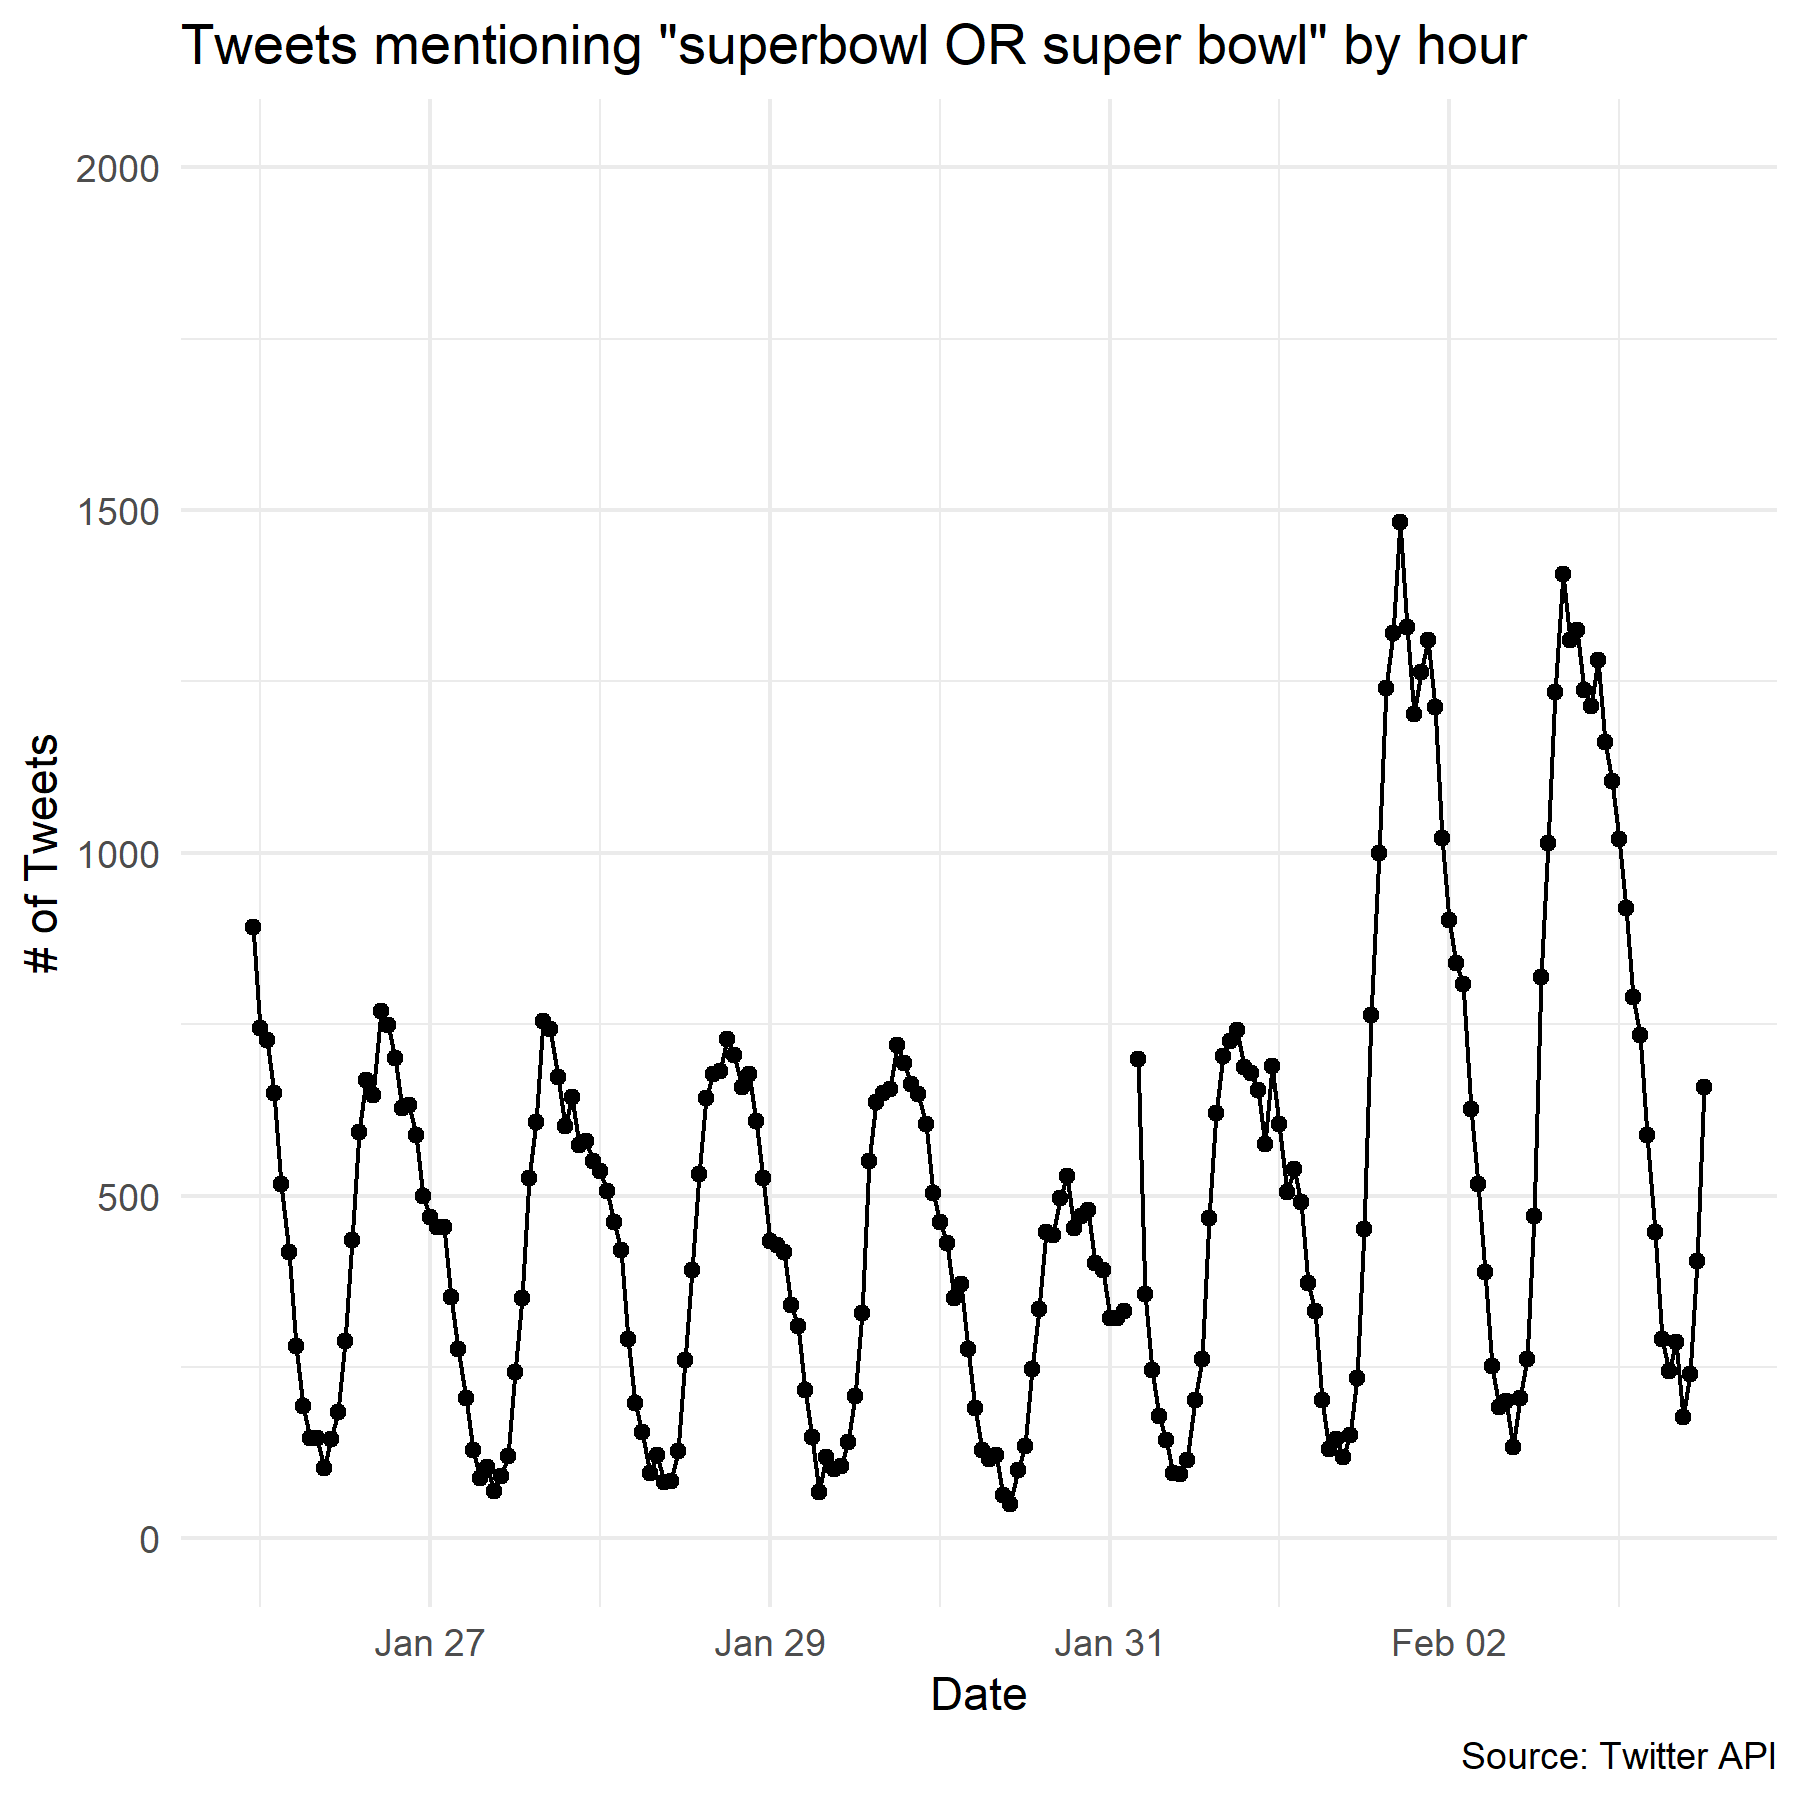
The time series clearly shows a cyclical day/night pattern corresponding to US time zones with an increase in the number of tweets in the last couple of days. The rest of the world is generally known to be indifferent to American football.
Data cleansing is a critical step in any analysis that identifies inaccurate, incomplete, or irrelevant data and then deals with those data issues. Dirty data can be dangerous by leading to wrong conclusions with potentially large negative impact to reputations and business results. This concept is commonly simply stated as ‘garbage in, garbage out.’ Briefly, we cleansed the tweets as follows,
- Converted all characters to lowercase.
- Removed any ‘@username’.
- Removed most punctuation.
- Removed links.
- Removed extra spaces.
- Removed stop words (very common words that generally have little value in analyses including ‘a’, ‘an’, ‘and’, ‘are’, ‘as’, ‘at’, ‘be’, ‘by’, ‘for’, ‘from’, ‘has’, ‘in’, ‘is’, ‘it’, ‘of’, ‘on’, ‘that’, ‘the’, ‘to’, ‘was’, ‘were’, ‘will’, ‘with’)
Exploratory data analysis (EDA) should be the starting point for any data analysis project. The focus is to get to know the data and making sense of it. EDA is critical step to help formulate questions to ask the dataset and how manipulate the data to extract the needed answers. John Turkey widely credited with the originally developing EDA in the 1970s stated,
Exploratory data analysis is an attitude, a state of flexibility, a willingness to look for those things that we believe are not there, as well as the things we believe might be there. John TukeyPerforming exploratory data analysis commonly utilize data visualizations to convey important information at a glance. Exploratory data analysis commonly consists of combinations of the following:
- Summary statistics such as minimum, maximum, mean, standard deviation
- Distributions of variables
- Trends of variables
- Correlations and relationships between variables
- Clustering to reveal patterns
- Dimension reduction techniques for high dimensionality datasets
Where are People Tweeting about the Super Bowl?
For the first time in Super Bowl history a team, the Tampa Bay Buccaneers, will play the Super Bowl in their home stadium. The chart below shows the locations where the most Super Bowl tweets originated. It is no surprise that Tampa, FL and Kansas City, MO are near the top as the home cities of the teams. Others at the top of the list include the most populous cities and media hubs.
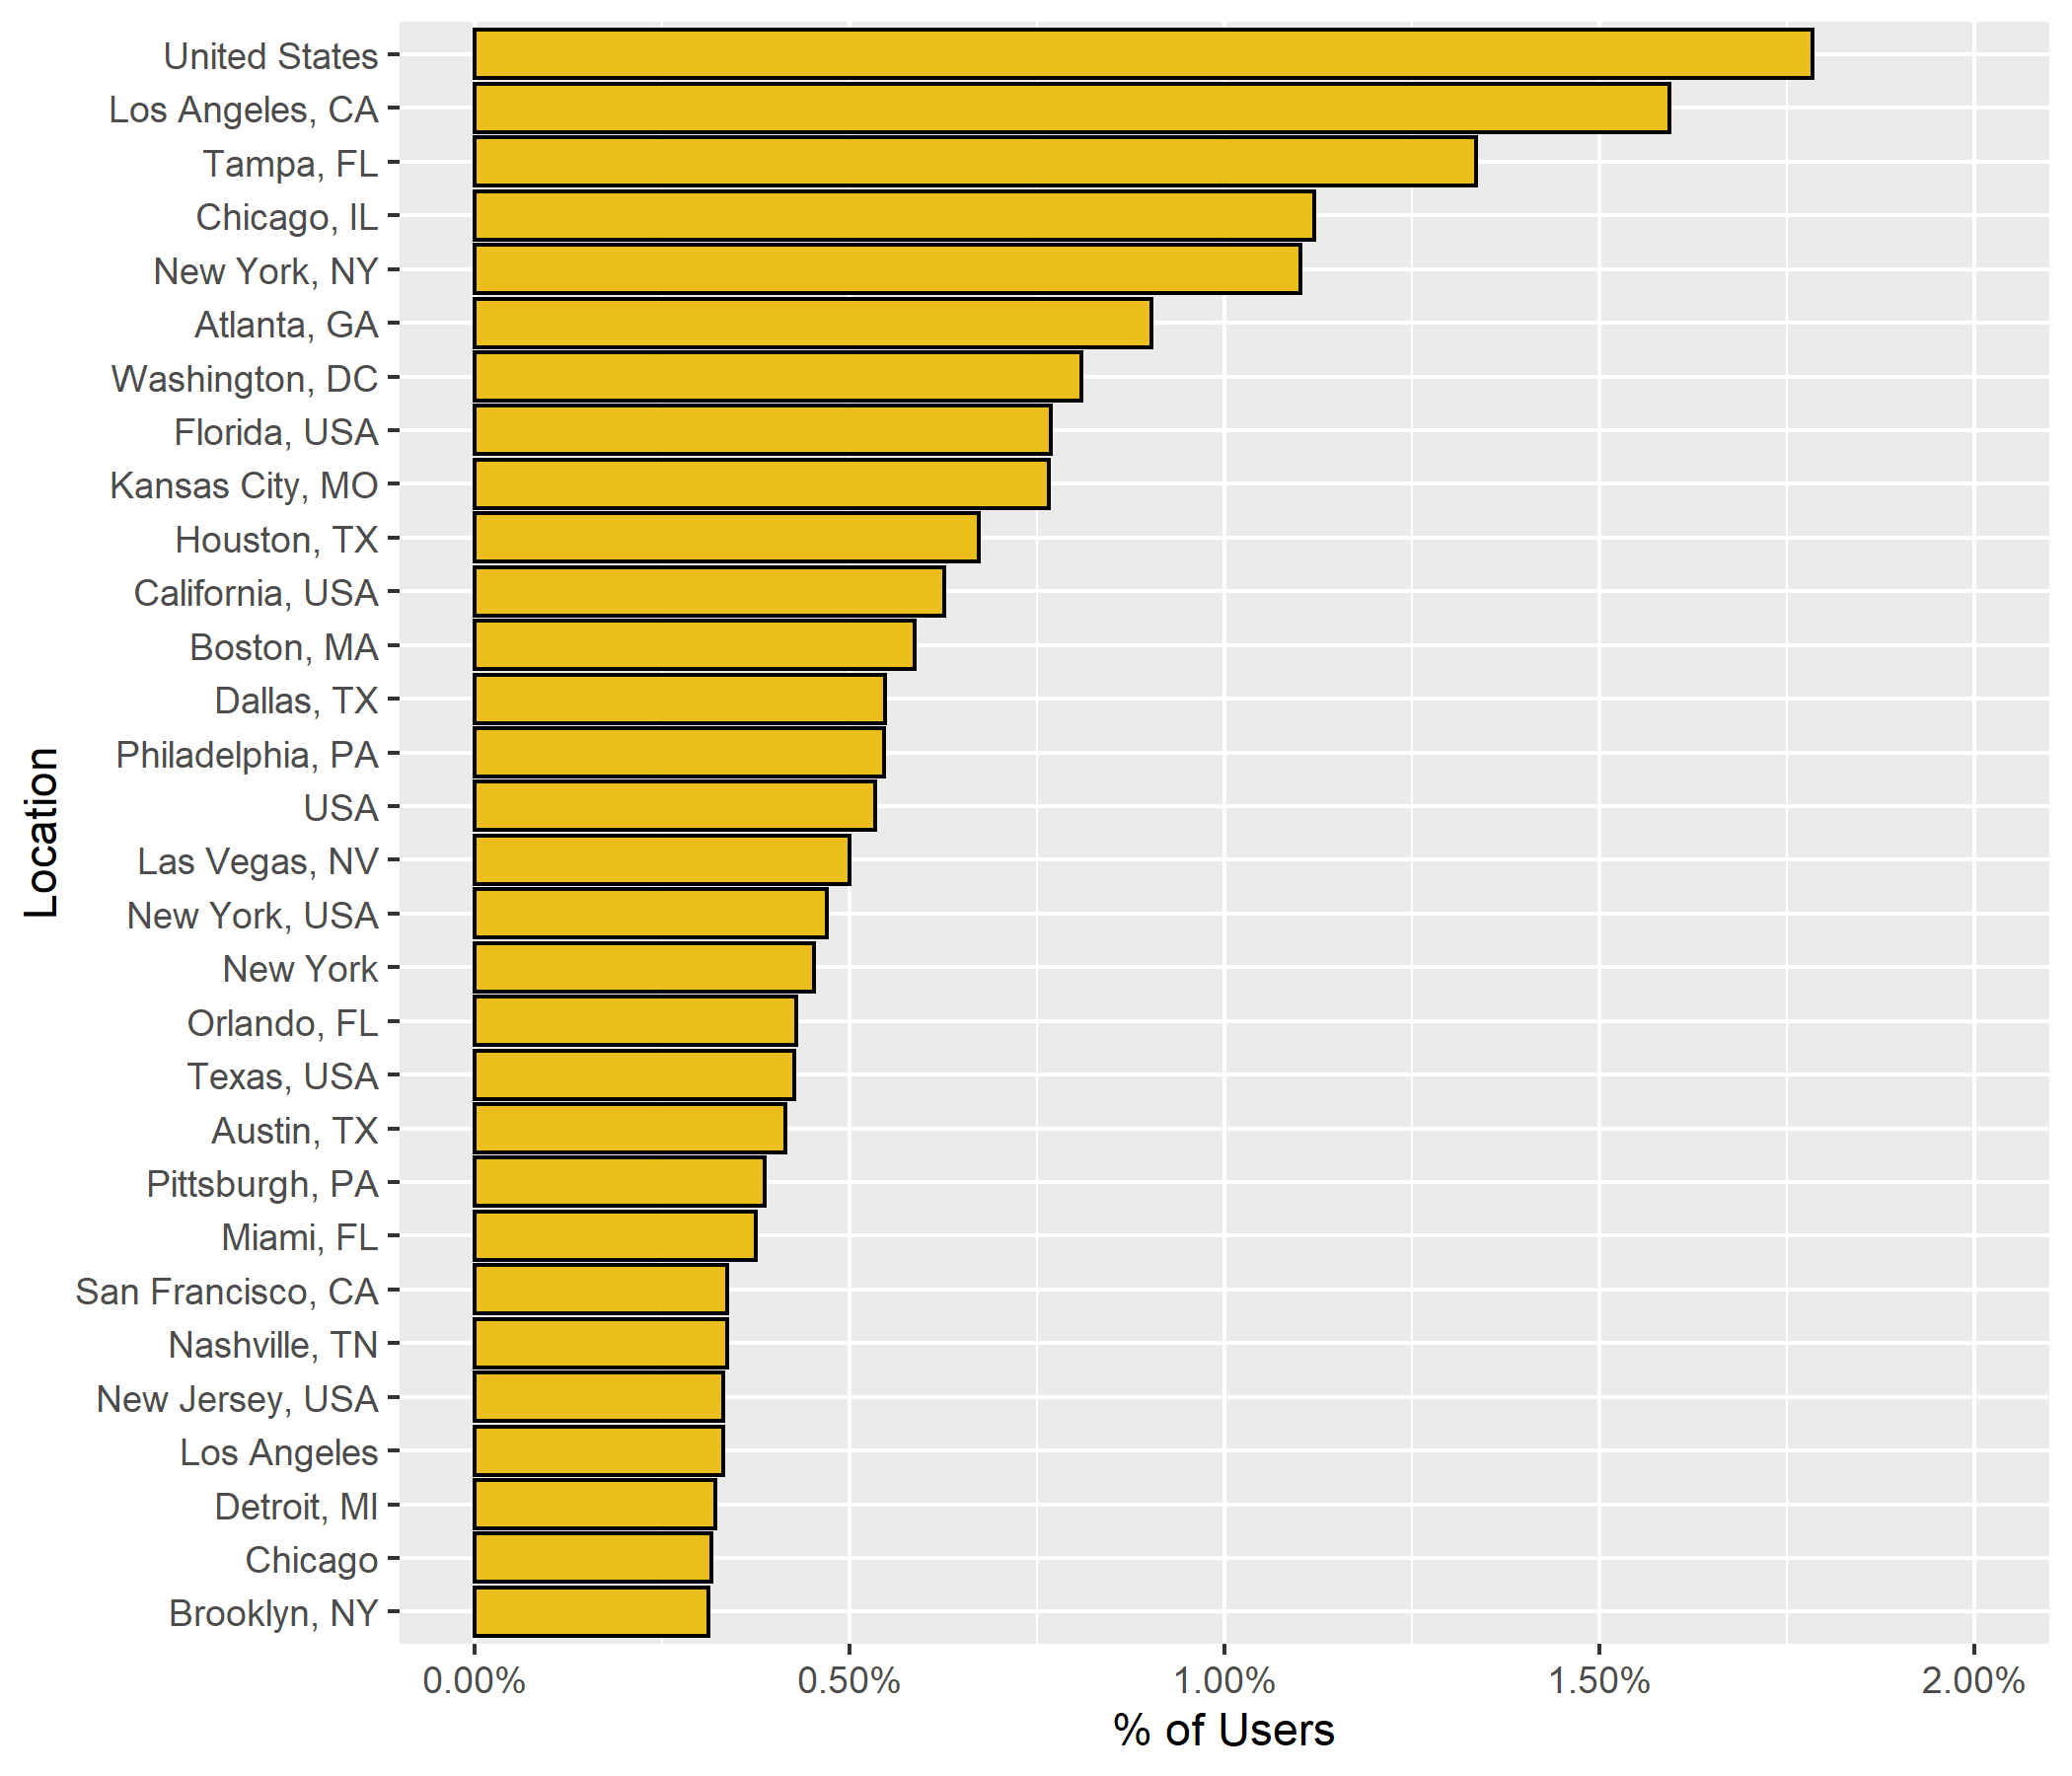
None of locations of the top 30 locations in the chart are outside the US. Further down the list, ‘Canada’ is the international origin of the most tweets about the Super Bowl ranking as the 39th most frequent location. The next several non-US locations are ‘Toronto Ontario’, ‘London England’, ‘London’, ’Toronto’, ‘United Kingdom’, and ‘Australia’.
Does the Super Bowl have the most international interest in Canada, the United Kingdom, and Australia because they are predominately English-speaking countries or because they have the most American residents? Maybe the common factor is that Queen Elizabeth II of the United Kingdom and Commonwealth realms happens to be a huge fan of the NFL (our brief googling was unable to confirm this speculation). Perhaps it is the result of the London hosting NFL games since 2007.
A ranking of countries with the most American expats has some familiar countries.- Mexico 762,290
- Canada 270,217
- United Kingdom 215,915
- Germany 127,218
- Australia 114,549
840 million people worldwide speak English and not surprisingly the United States is the country with the most English speakers. The next several countries with the greatest English-speaking residents are India, Pakistan, the Philippines, Nigeria, and finally the United Kingdom. While 98% of the British speak English the country’s relatively small population places it behind some more populous countries.
We hypothesize the important factors determining which countries are most interested in the Super Bowl are a combination of the number of American expats, the number of English-speakers, countries that have professional leagues such as the CFL in Canada, and where the NFL promotes the game abroad. A more rigorous analysis is needed to understand this better.
How are People Tweeting?
The source of a tweet describes what the user used to post the tweet. The users in our dataset posted tweets from a total of 804 unique sources. However, ‘Twitter for iPhone’ accounted for nearly half of the tweets and the top 3 consisted of over 80%.
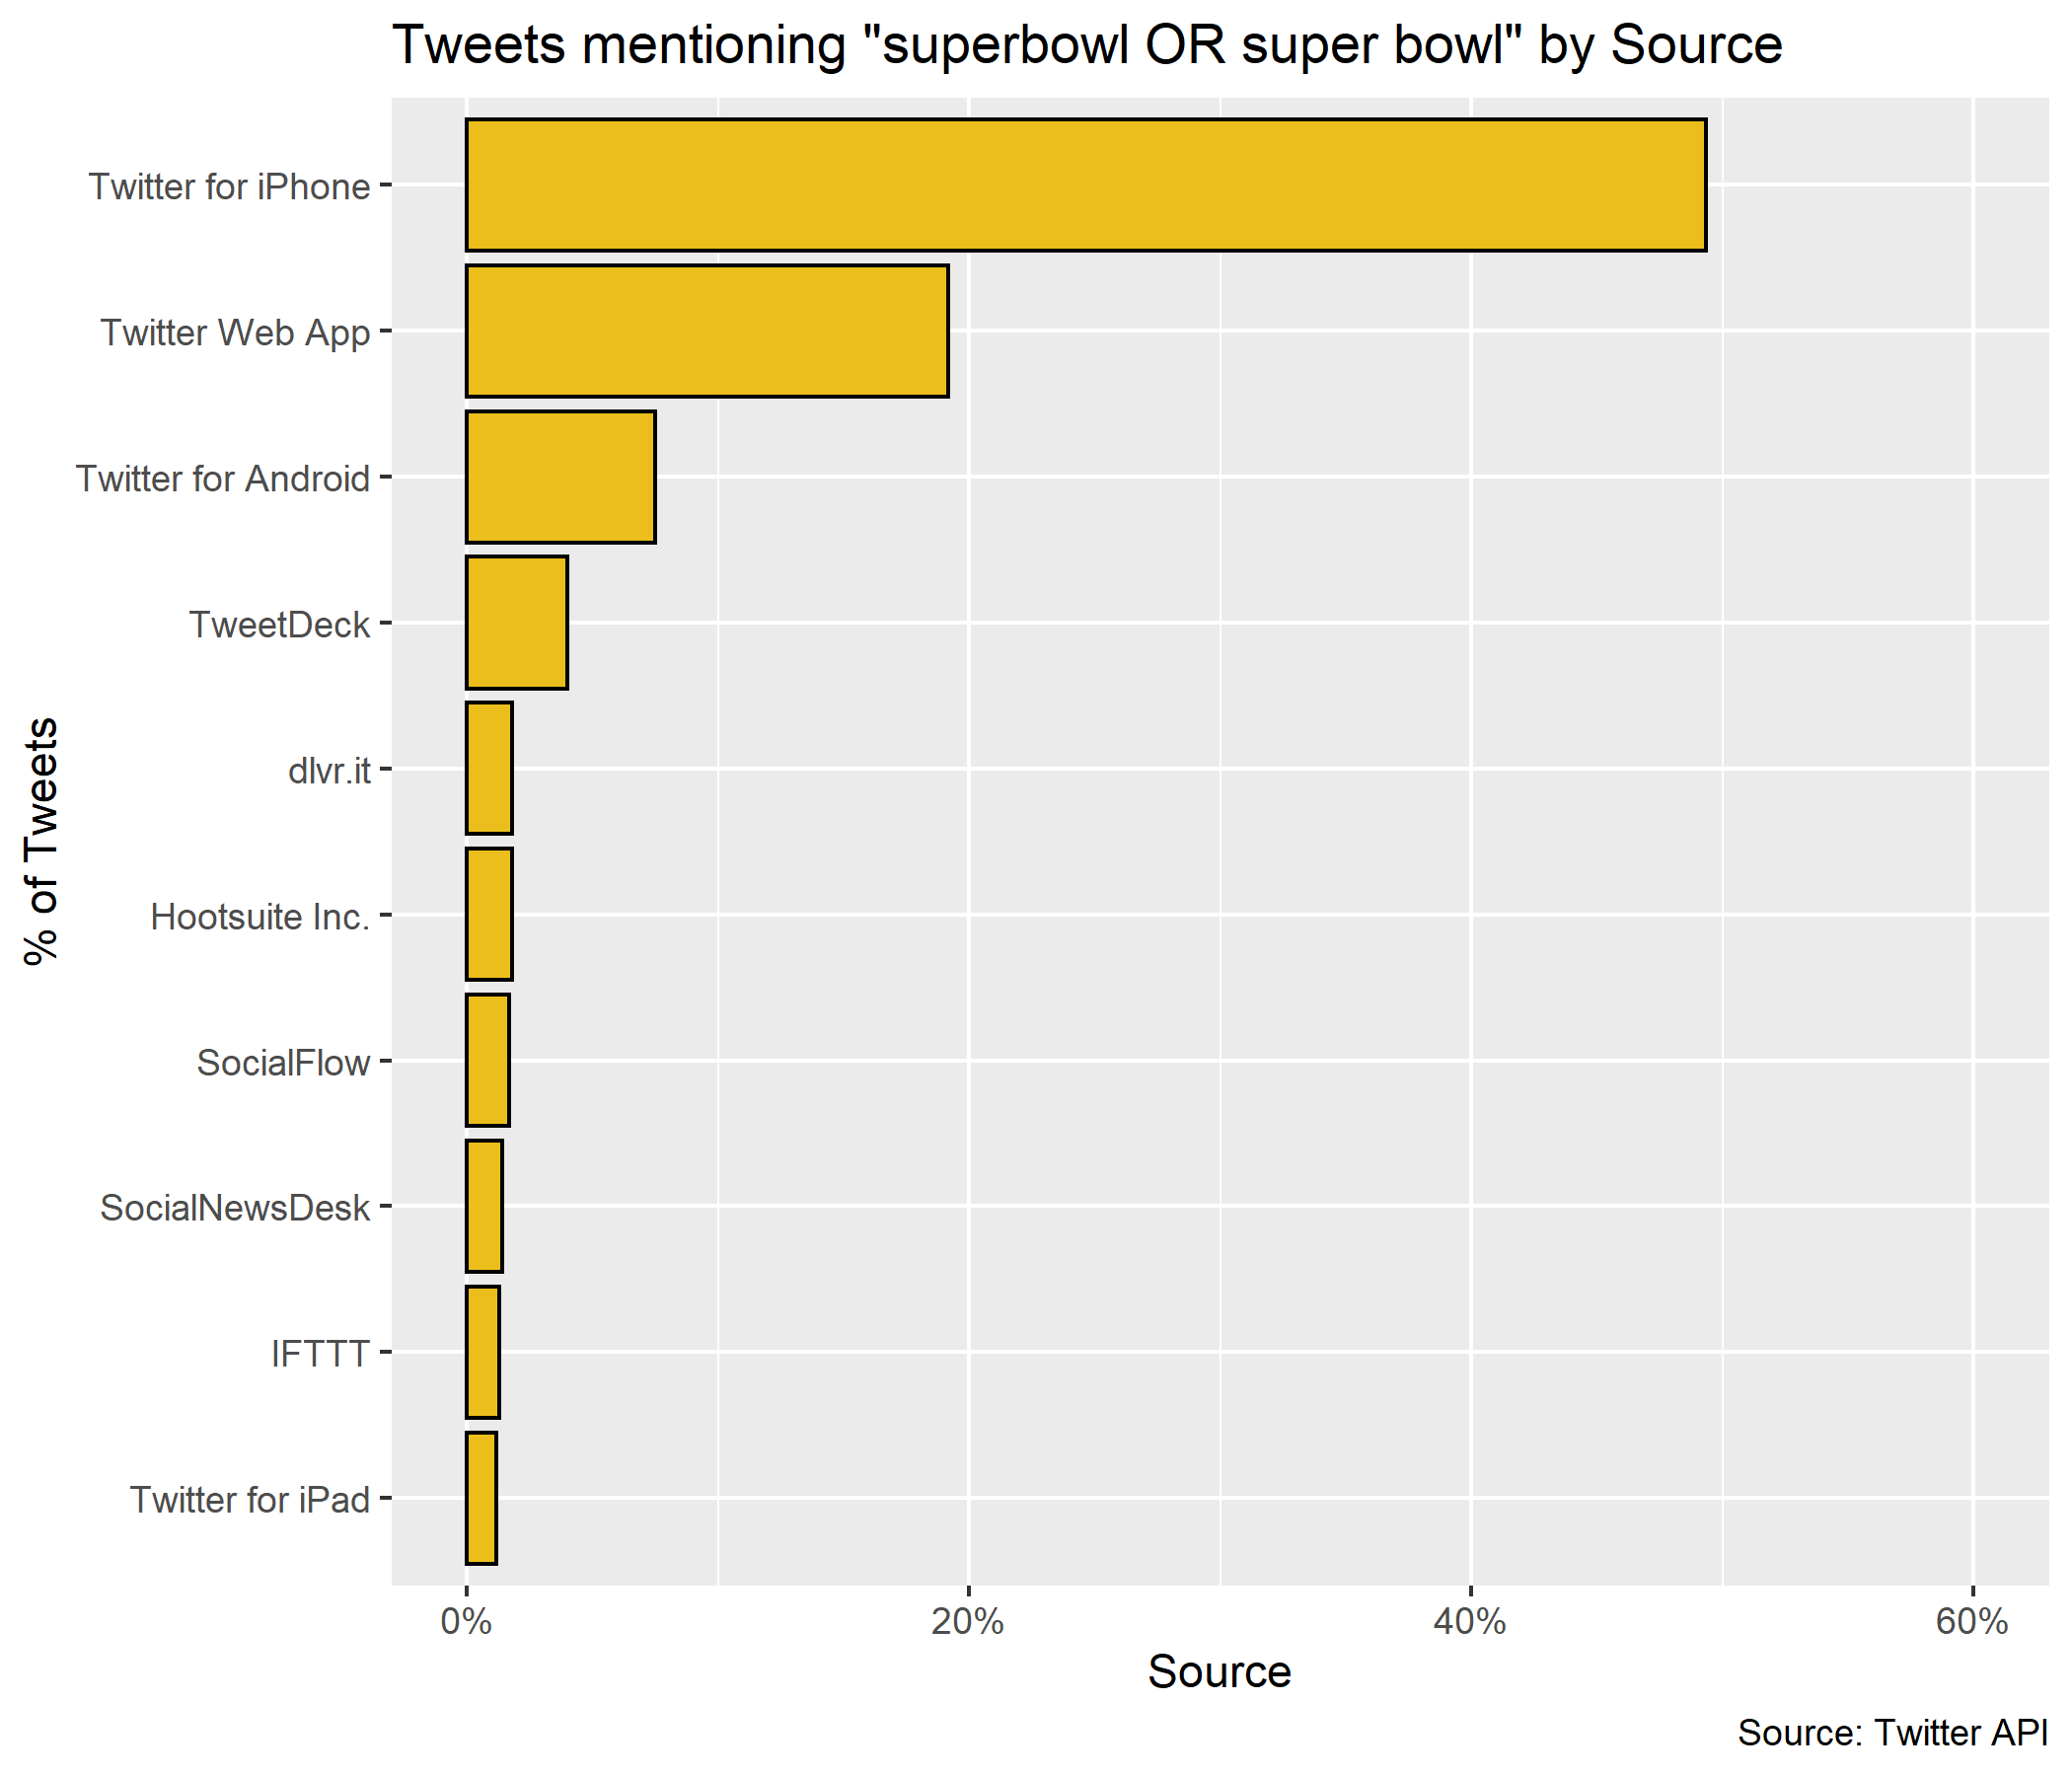
Android has 39% of the mobile operating system market share in the US and iOS dominates at 61%. Limiting our data to just the ‘Twitter for iPhone’ and ‘Twitter for Android’, yields only 28% for Android and 72% for iPhone. People that tweet about the Super Bowl are more likely to use an iPhone than the general population. Perhaps in a future post we’ll examine in more detail the demographic differences of iPhone and Android users.
What is Being Said?
Word clouds are a visualization of text that work in a simple way – the more often a word appears in the text, in our case tweets, the larger that word appears. It is a powerful tool to convey crucial information in an easily digestible way. Word clouds break down text to allow viewers to immediately see the most frequent and therefore often the most important words. Good visualizations, such as word clouds, allow viewers to quickly understand a large amount of data.
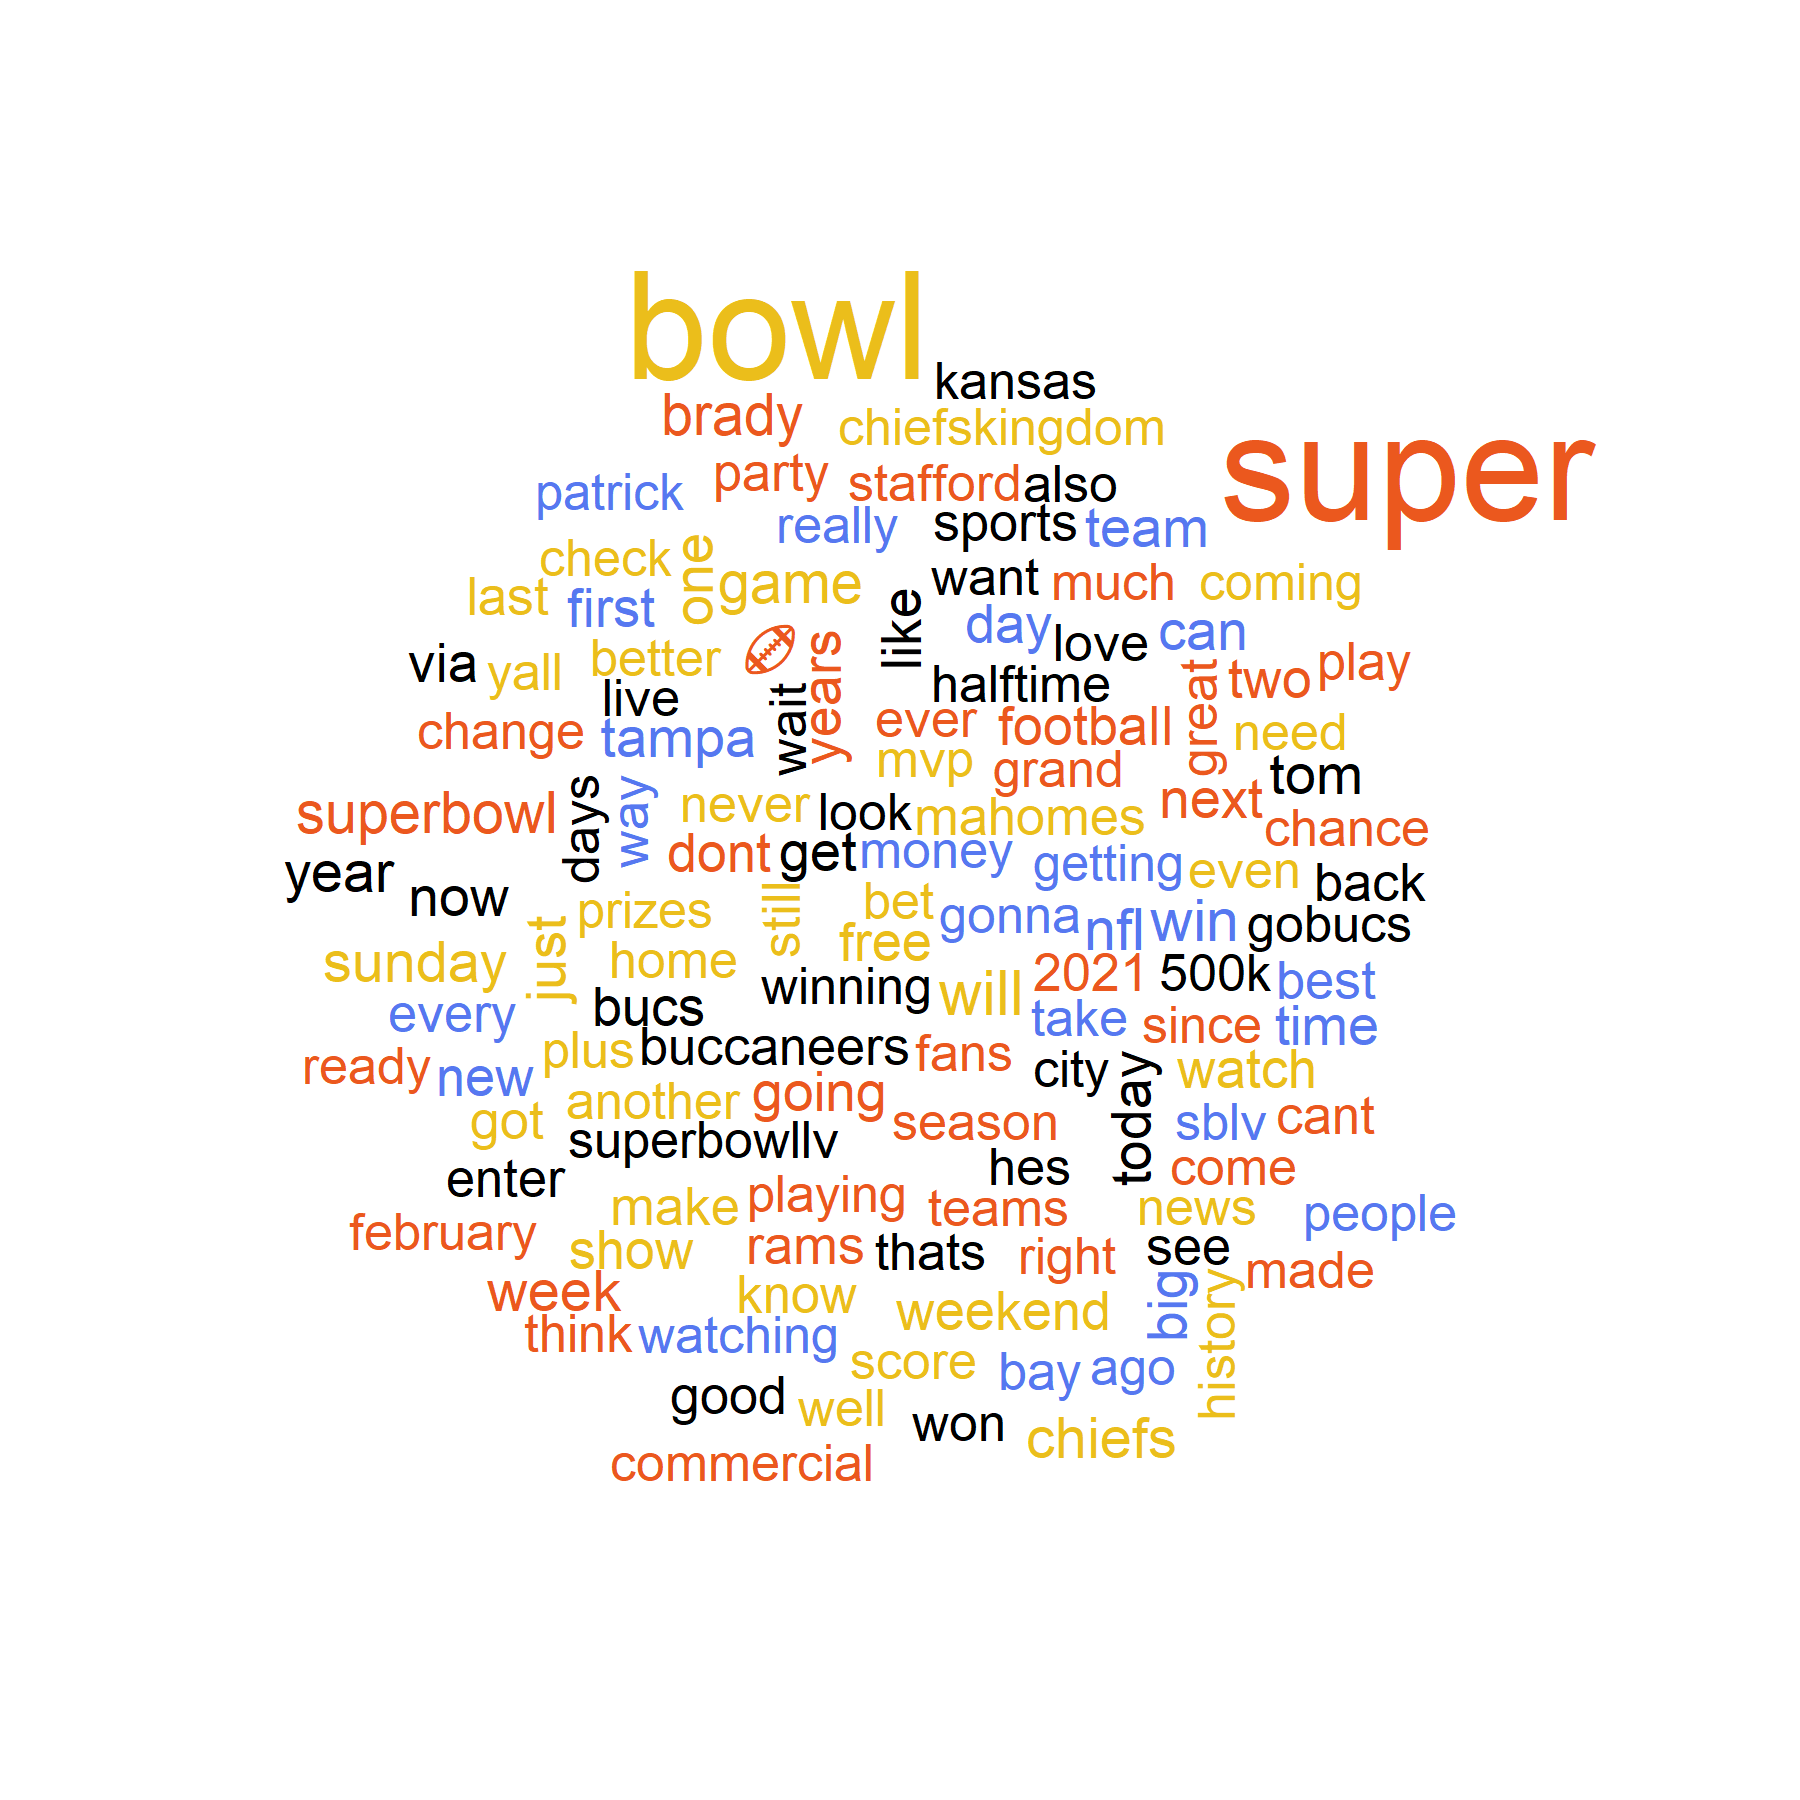
The words, ‘super’ and ‘bowl’, clearly dominates as we limited our analysis to tweets about the Super Bowl. The other words commonly appeared in the Super Bowl tweets.
How Many Tweets Use Hashtags?
Hashtags are frequently employed by users in tweets to categorize into topics making it easier for others to follow and find tweets on a common topic. They are a great way to get your tweets in front of an interested audience that will find them relevant. Hashtags are insanely powerful and the right ones can drive unbelievable engagement.
Let’s see how many hashtags the tweets in our dataset contained. Only 23% of the tweets included at least one hashtag. Studies have shown that tweets with hashtags receive 2 times more engagement than those without. The 77% of tweets without a hashtag would likely benefit by the poster including a hashtag.
However, there can be too much of a good thing. Twitter recommends one to two hashtags per tweet. Tweets with more than two hashtags show a 17% drop in engagement as too many clickable parts of a tweet can distract people.
Only 23% of the tweets included at least one hashtag. Studies have shown that tweets with hashtags receive 2 times more engagement than those without. The 77% of tweets without a hashtag would likely benefit by the poster including a hashtag.
However, there can be too much of a good thing. Twitter recommends one to two hashtags per tweet. Tweets with more than two hashtags show a 17% drop in engagement as too many clickable parts of a tweet can distract people.
Which Hashtags are Being Used?
Previously, we showed a word cloud for words in the tweets, now let’s look at the word cloud for hashtags only.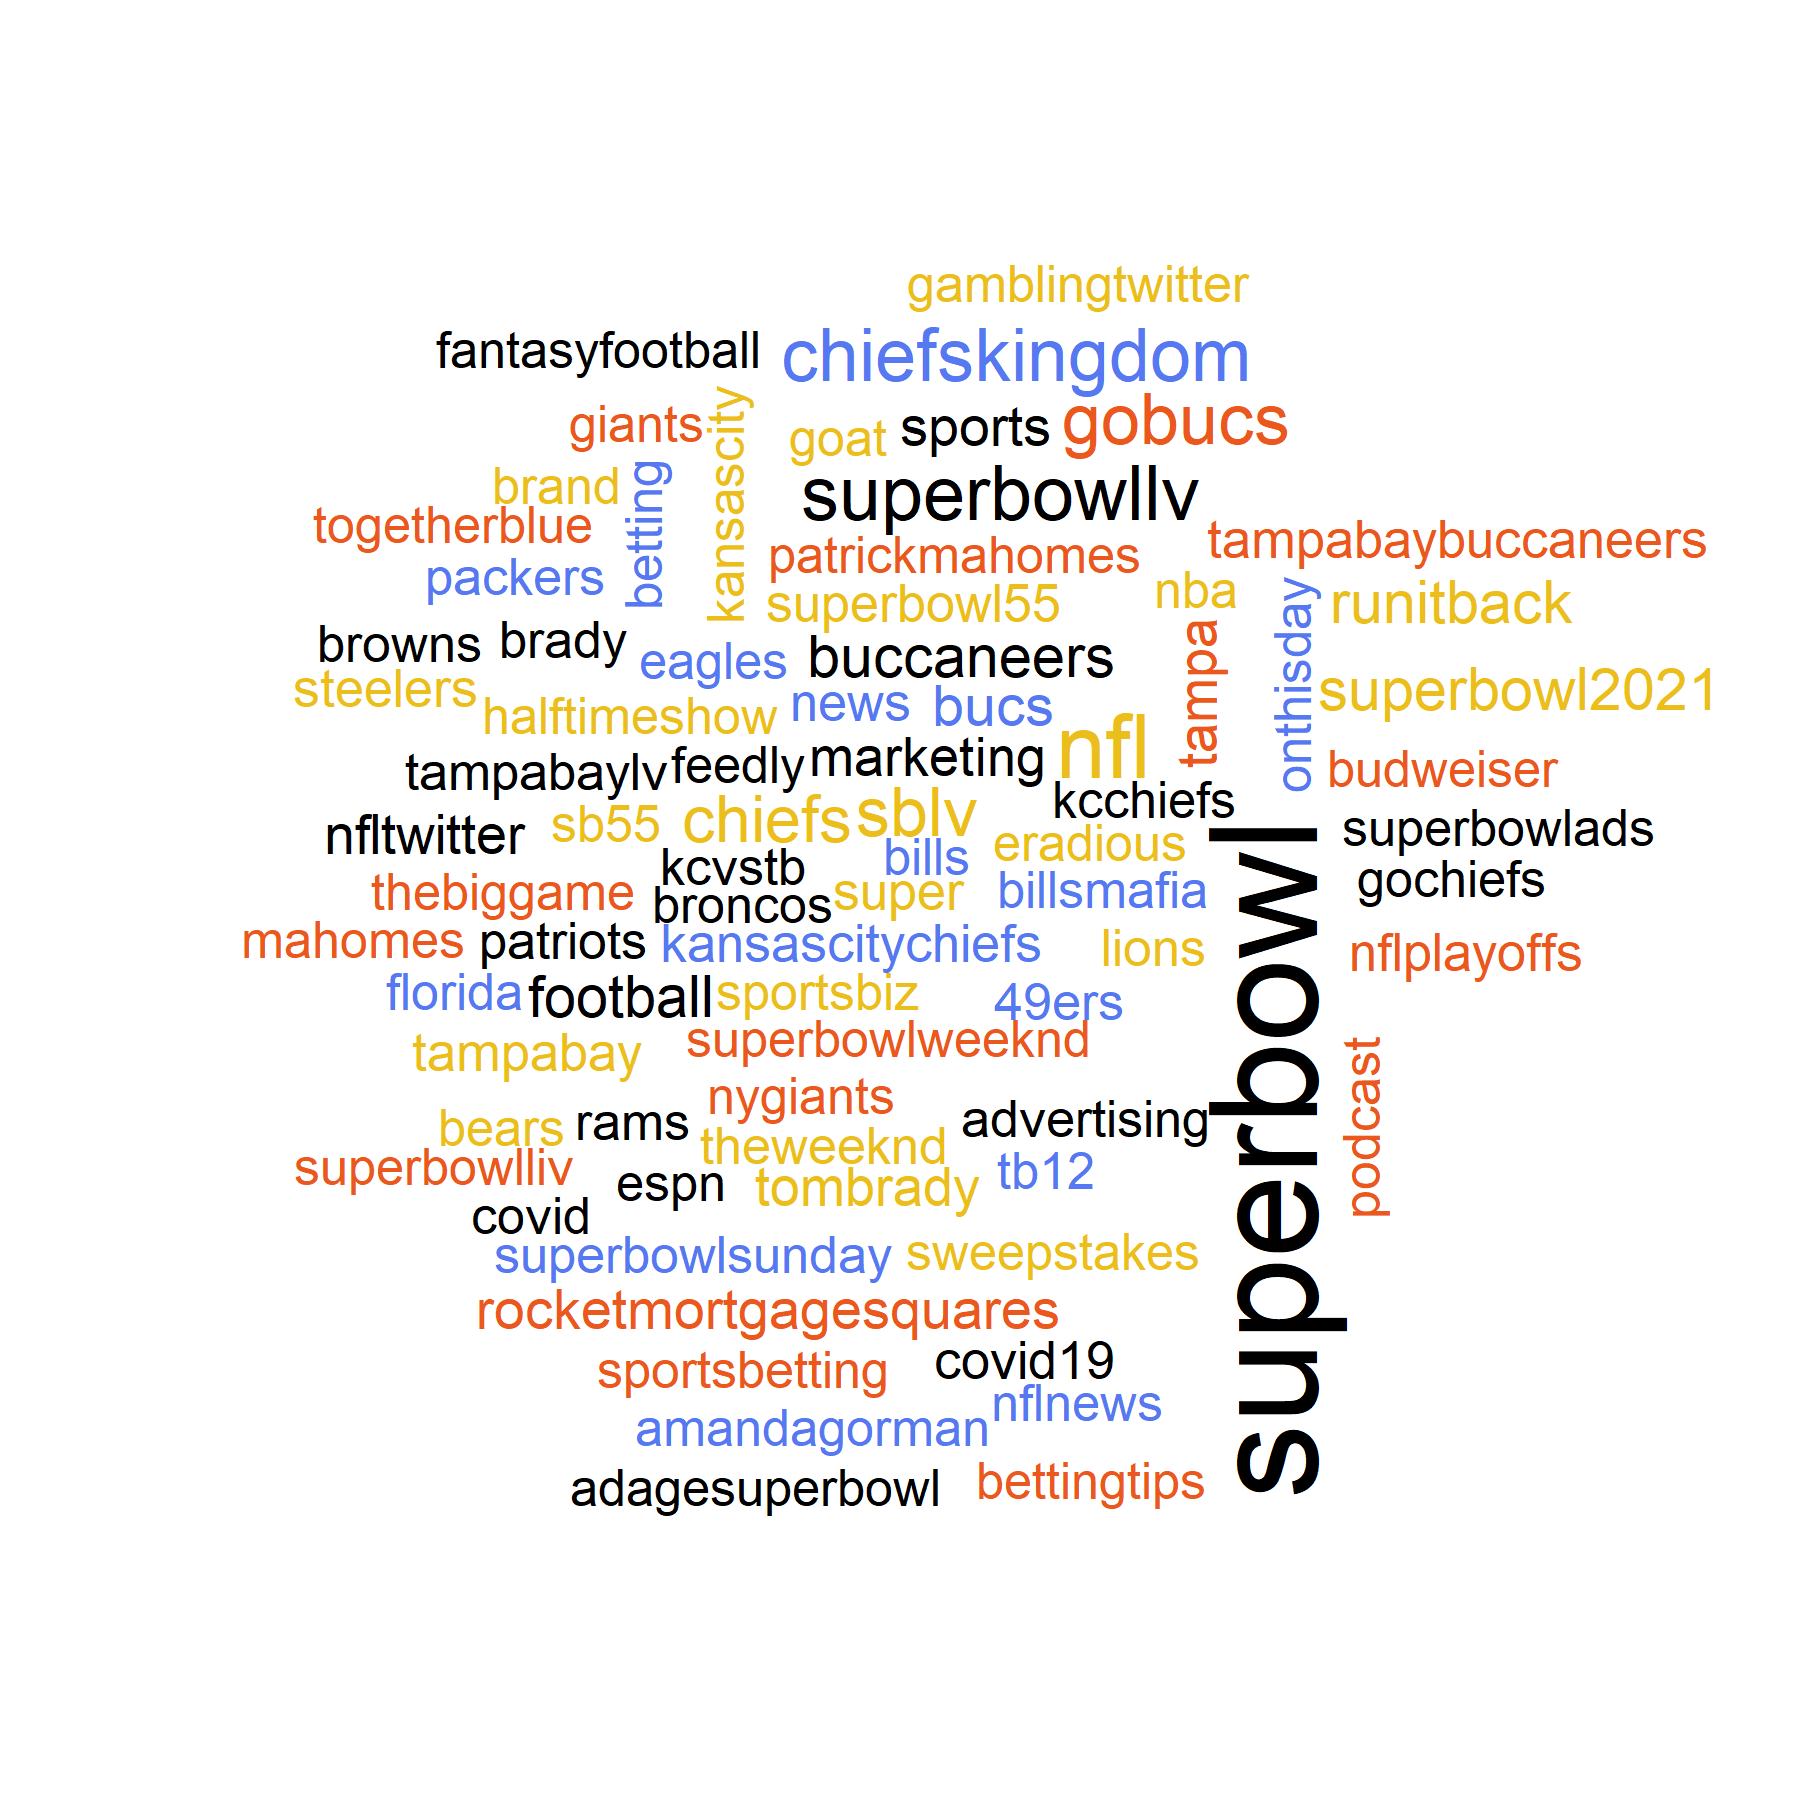
Again ‘superbowl’ dominates as the most common hashtags. Hashtags of the players and teams participating in the Super Bowl are commonly used. In addition, there are some other interesting hashtags related to entertainment such as ‘halftimeshow’ and ‘amandagorman’, who gained national acclaim at President Biden’s inauguration and will recite an original poem before the game.
According to the American Gaming Association, a total of $4.3 billion will be bet on this year’s Super Bowl by 23.2 million Americans. That does not include the wagering on Super Bowl Squares common amongst friends, family, and colleagues. Therefore, not surprisingly several of the most common hashtags are related to gambling such as ‘sportsbetting’, ‘gamblingtwitter’, and ‘bettingtips’.
What would a Super Bowl be without its commercials? A recent survey found that of those who watched the Super Bowl, 20% watched just for the ads. In 2020, a 30 second commercial cost on average $5.2MM. The Twitter data shows that ‘superbowlads’, ‘marketing’, and ‘advertising’ are common hashtags along with specific brands including, ‘budweiser’ and ‘rocketmortgagesquares’.
Who is More Loved, Tom Brady or Patrick Mahomes?
Sports fans are known to be a passionate and emotional bunch. Let’s explore what types of emotions are expressed in the tweets about the Super Bowl. We break down the differences in emotions felt for the Chiefs and the Buccaneers, as well as determine who is more loved, Tom Brady or Patrick Mahomes.
Sentiment analysis is a powerful technique used to interpret and classify text by tagging with a certain sentiment, usually positive, negative, or neutral. We used a more sophisticated approach, the fantastic NRC Emotion Lexicon, that associates text with eight basic emotions (anger, fear, anticipation, trust, surprise, sadness, joy, and disgust) in addition to the two sentiments (positive and negative).
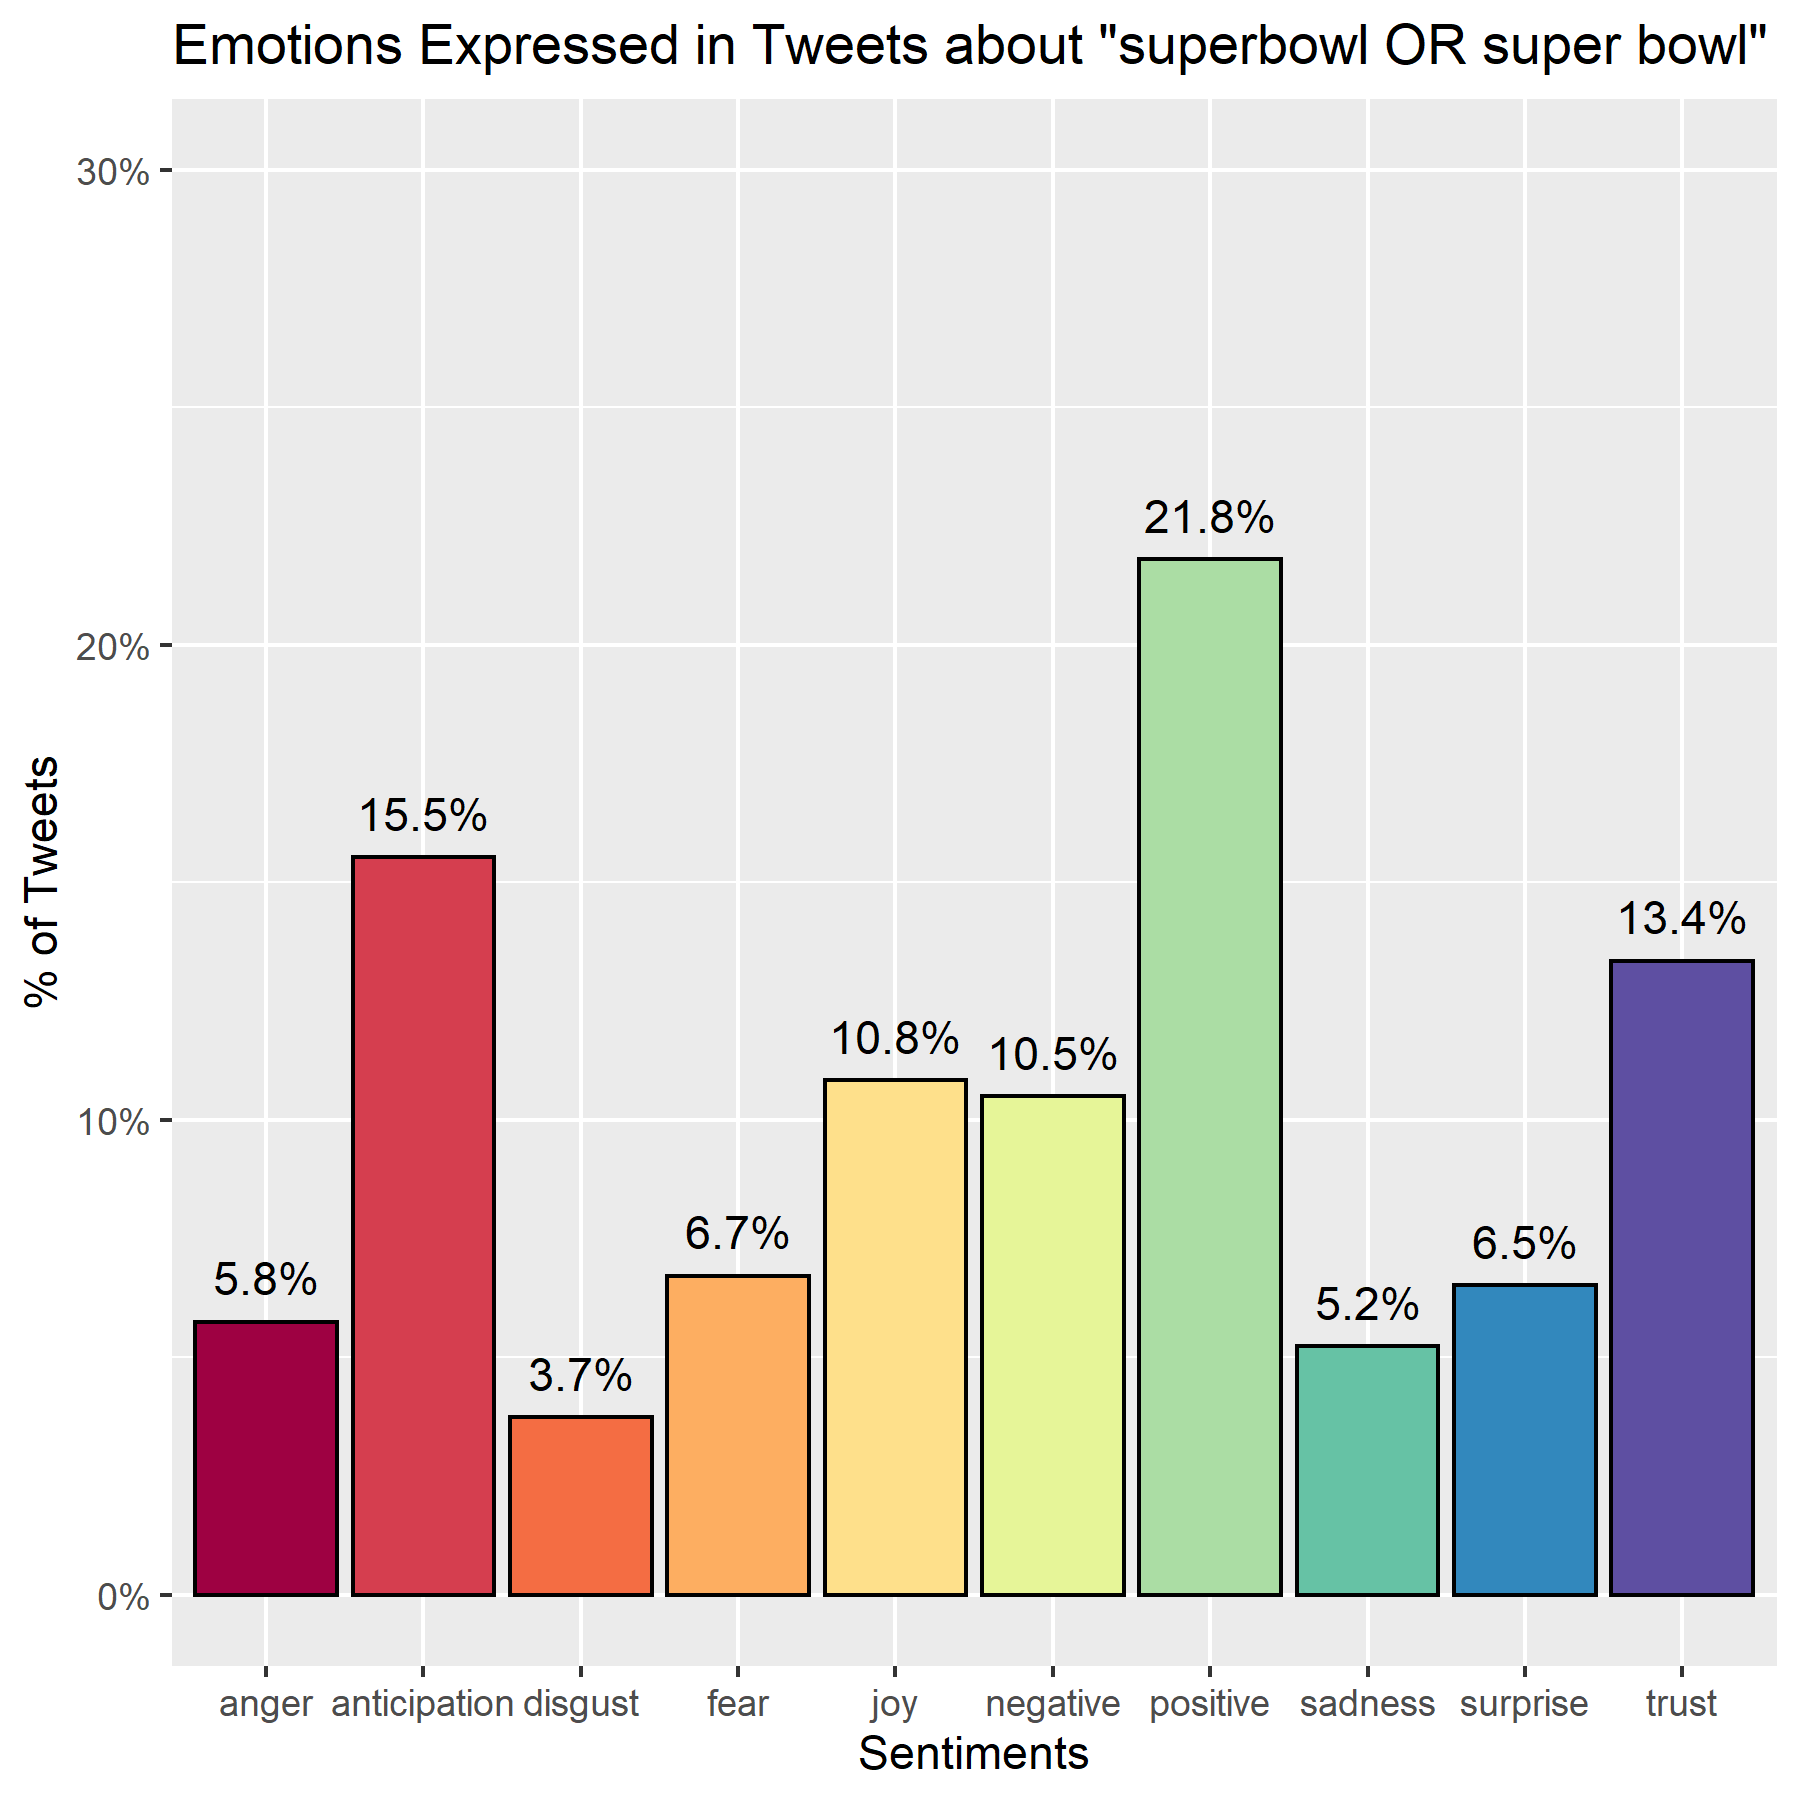 In our data of tweets about the Super Bowl more positive emotions are expressed than negative ones. ‘Anticipation’ is the most common emotion present in these tweets leading up to Super Bowl weekend.
Now, we compare the differences between how people feel about the Kansas City Chiefs and the Tampa Bay Buccaneers. We filter and categorize the tweets into two groups, 1) the 6,652 tweets about the Chiefs and 2) the 3,959 tweets about the Buccaneers. Tweets that include both Kansas City and Tampa Bay are excluded so there is no overlap between the two groups.

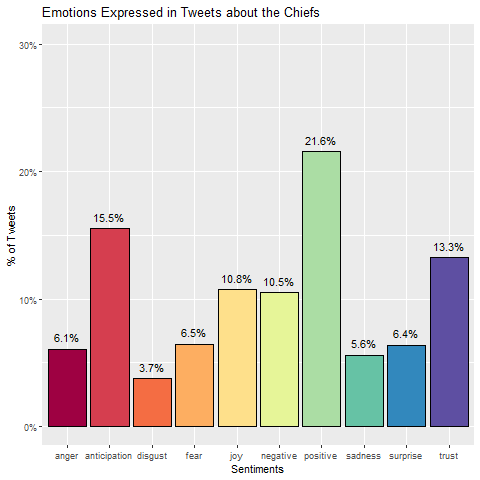
It is close but tweets about the Chiefs express more anticipation and more positive sentiment about the Super Bowl that those about the Buccaneers. This is superficially aligned with the facts that the Chiefs have the better regular season record and are a slight favorite.
A major media storyline for the game is the opposing quarterbacks. Hyped as the greatest quarterback duel ever pitting Tom Brady, the aging legend with more than a handful of Super Bowl rings, versus Patrick Mahomes, aiming to be the youngest quarterback to lead their team to consecutive Super Bowl wins. There are 6,564 tweets about Brady compared to 1,692 about Mahomes, making Brady the much more talked about quarterback.
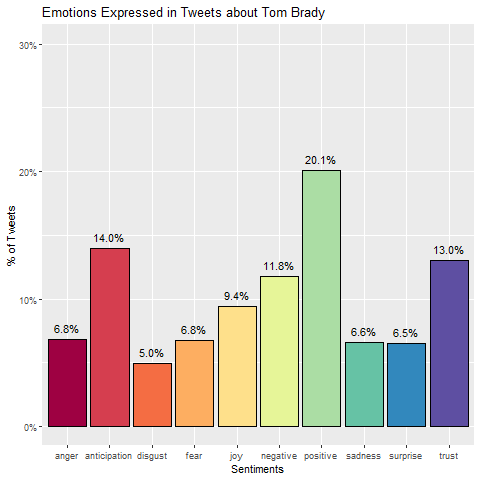
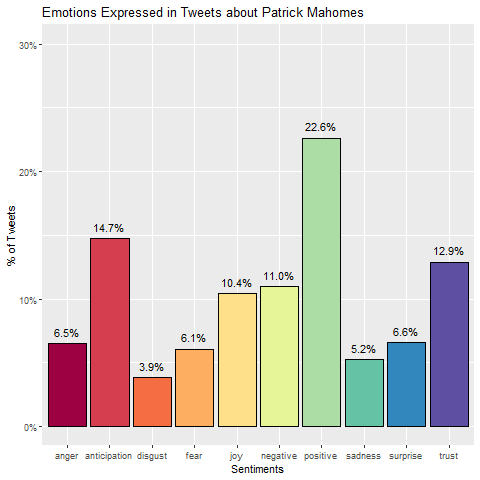 Tom Brady may be more popular than Patrick Mahomes, but he is not more loved. Tweets about Mahomes contain more positive sentiments, anticipation, and joy.
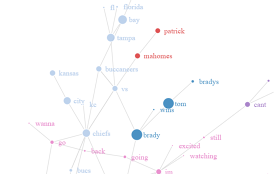
Network Analysis
Thus far, we have examined what are the most common words and hashtags and then the emotions expressed in the tweets. Now, we will explore the relationships between the words and hashtags using networks to visualize the results. First, we’ll look at bigrams, meaning two words that appear next to each other. How do we visualize how often two words occur adjacent to each other?- Each word is plotted as a node (in other words, a circle) where the size of the node represents how many tweets contain that word.
- Words are connected if they form a bigram where the thickness of the line connecting them represents the number of tweets the bigram appears in.
This reveals which words often appear in sequence in the tweets. The words ‘super’ and ‘bowl’ are featured prominently in the middle like a binary star system since these are the two words most commonly appearing together. We observe some often-used sequences of words, for example, ‘tampa bay buccaneers vs chiefs’, ‘inaugural poet amanda gorman’, and ‘7th february sunday’
This is a start to understand the common themes of the tweets. We remove the dominant words, ‘super’ and ‘bowl’, from the network to reveal patterns. We find clusters in the network using the Louvain method to extract communities from the network. Nodes are color coded to indicate which of the 14 identified clusters they are in.
People tweeted about the upcoming Super Bowl on a variety of topics. To point out just a few,- The light brown cluster of tweets involving health care workers that received free tickets to the game and will make up most of the spectators.
- The pink cluster centered on ‘im’ consisting of people tweeting what they are doing related to the Super Bowl.
- The dark green cluster represents marketing promotions.
- The light blue cluster of tweets is about the teams playing.
- The blue group is talking about eSports.
- The red conversation is about the media.
- The light green community are focused on advertising and marketing.
- The light orange is concentrated on college football.
- A purple group of Bills fans sticks out.
What’s Next?
Tweets contain a wealth of information and we have only scratched the surface. In this post we studied the locations and sources of the Super Bowl tweets, the emotions and sentiments of those tweets, and the relationships between words and hashtags. There is much more to explore in future posts.
We haven’t looked at the data available on the number of likes and retweets that each tweet garnered. Future analysis can uncover what characteristics of a tweet generates greater engagement. Building a machine learning model will help to optimize tweets to maximize retweets and likes.
While this post visualized relationships between the words and hashtags in tweets, the relationships between the users are a fruitful path to pursue. We can identify the social networks of who follows whom. Additionally, we can examine all the tweets from these users to form a more holistic view into their lives beyond the Super Bowl.
After the Super Bowl we may analyze the trends of tweets posted during the game.