Insights into What Twitter Felt About the Super Bowl
Twitter Super Bowl Data
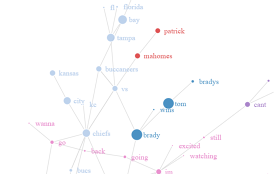
For this post we pulled all tweets from approximately 11am on Super Bowl Sunday to noon the following day containing the search terms ‘superbowl’ or ‘super bowl’ either in the text or as a hashtag. Only tweets in the English language were included with retweets, replies, and duplicates excluded. There were 443,691 tweets that met our criteria from 344,810 unique users, meaning that roughly 1 out of every 1,000 Americans tweeted about the Super Bowl. Clearly the number of tweets rose dramatically with the start of the game and rapidly dropped off at the end. There are isolated moments during the Super Bowl where the number of tweets briefly skyrocketed. We will explore in detail what events triggered people to tweet at the same time, but you would be correct to guess that these coincide with pivotal moments of the game. Before we examine those key events, let’s look at the geographic distribution of where tweets originated by state over time. It demonstrates what we already know that the number of tweets increased during the game and the states with the most tweets are also the most populous.
What Were the Key Moments?
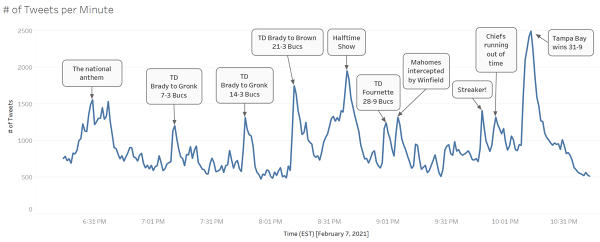
The number of tweets per minute spiked 10 times during the Super Bowl corresponding to the most important moments that spurred people to tweet. The first spike occurred at 06:29 - 06:31pm (EST) during the national anthem. Not surprisingly, the three touchdowns scored by Tampa Bay in the first half each prompted a surge in tweets. Kansas City's two first half field goals failed to inspire people to tweet. Tweets peaked for the halftime show second only to the end of the game in the deluge of tweets. The streaker who interrupted the game by running across the field wearing a hot pink thong bathing suit, purportedly to win a bet, elicited a strong reaction. We will examine this moment and others in more detail later in this post.How Did Sentiment Change During the Super Bowl?
Humans may instinctively understand language, but only computers have the processing power to analyze millions of pieces of text quickly. For computers to do automated sentiment analysis well, they must be trained to comprehend how language can express human feeling. Sentiment analysis is a technique used to interpret and classify text by tagging with a certain sentiment, usually positive, negative, or neutral. Sentiments refer to the emotions that the author expresses in a particular portion of writing, including tweets. Sentiments are inherently subjective. Thus, they may depend on the cultural background, values, and beliefs of a person. You and I may not always agree on the sentiment of the same text. Nonetheless, most people will generally consider emotions like happiness, excitement, and amusement as positive and emotions like sadness, fear, and anger as negative. Sentiment Analysis is one of the more challenging tasks in Natural Language Processing. Even us humans sometimes misinterpret someone’s email or text. I’m sure that this has happened to all of us – an email misread as rude by a coworker or a text not understood correctly by a friend. Combine this with how many social media messages mix text with emojis, and, suddenly, the interpretation of sentiment can become even more complicated. We split our dataset into tweets about the Chiefs and those about the Bucs. A timeseries of the positive or negative sentiment of those tweets are graphed in 15 minute periods. The positive sentiment of tweets about the Kansas City Chiefs declines from 7pm to 8pm (EST) as Tom Brady threw two touchdowns to Rob Gronkowski building a 14-3 lead for the Bucs. Tweets about the Tampa Bay Buccaneers exhibited not such steep decrease in positive sentiment on their way to winning Super Bowl LV.What Were Best Tweets about the Super Bowl?
We determined the best tweets simply by those that earned the most likes. Without any more introduction, here are the top 6 Super Bowl tweets submitted for your perusal.There should be a reverse super bowl with the shittiest teams of the season and the one that loses wins worst team of the year
— alicia (@nerdjpg) February 7, 2021
not my in-person graduation canceled but the super bowl looking like this during a pandemic. pic.twitter.com/tXEoMzqSYG
— King Taurus (@TevonBlair) February 7, 2021
Lmfao so a couple weeks ago my Manager said I was going to be attending the Super Bowl this year... I got real excited ....but this is what she meant 😂😂😂 pic.twitter.com/HeMb3vSNEG
— BretmanRock’s Year (@bretmanrock) February 7, 2021
super bowl party at my place!! all 25 of us were tested in august and there’s a fan going so no need for hateful comments :)
— giabuchi lastrassi (@jaboukie) February 7, 2021
why more than half of my tl watching the super bowl? I thought y’all were gay
— R$ (@xxoorita) February 7, 2021
Poetry at the Super Bowl is a feat for art & our country, because it means we’re thinking imaginatively about human connection even when we feel siloed. I’ll honor 3 heroes who exemplify the best of this effort. Here’s to them, to poetry, & to a #SuperBowl like no other 💛
— Amanda Gorman (@TheAmandaGorman) February 7, 2021
What was Tweeted During the Super Bowl?
Word clouds are a visualization of text that work in a simple way – the more often a word appears in the text, in our case tweets, the larger that word appears. It is a intuitive way to convey a lot of information in an easily digestible way. Word clouds break down text to show the most frequent and therefore often the most important words. Good visualizations, such as word clouds, allow people to quickly understand a large amount of data. Let's take a look at what people tweeted about when the number of tweets spiked throughout the Super Bowl. Please note that this is raw Twitter and we did not filter out profanity. Many people need to get their dirty mouths washed out with soap (or maybe more accurately it should be their dirty fingers). Tweets during the national anthem predictably were focused on the pre-game entertainment.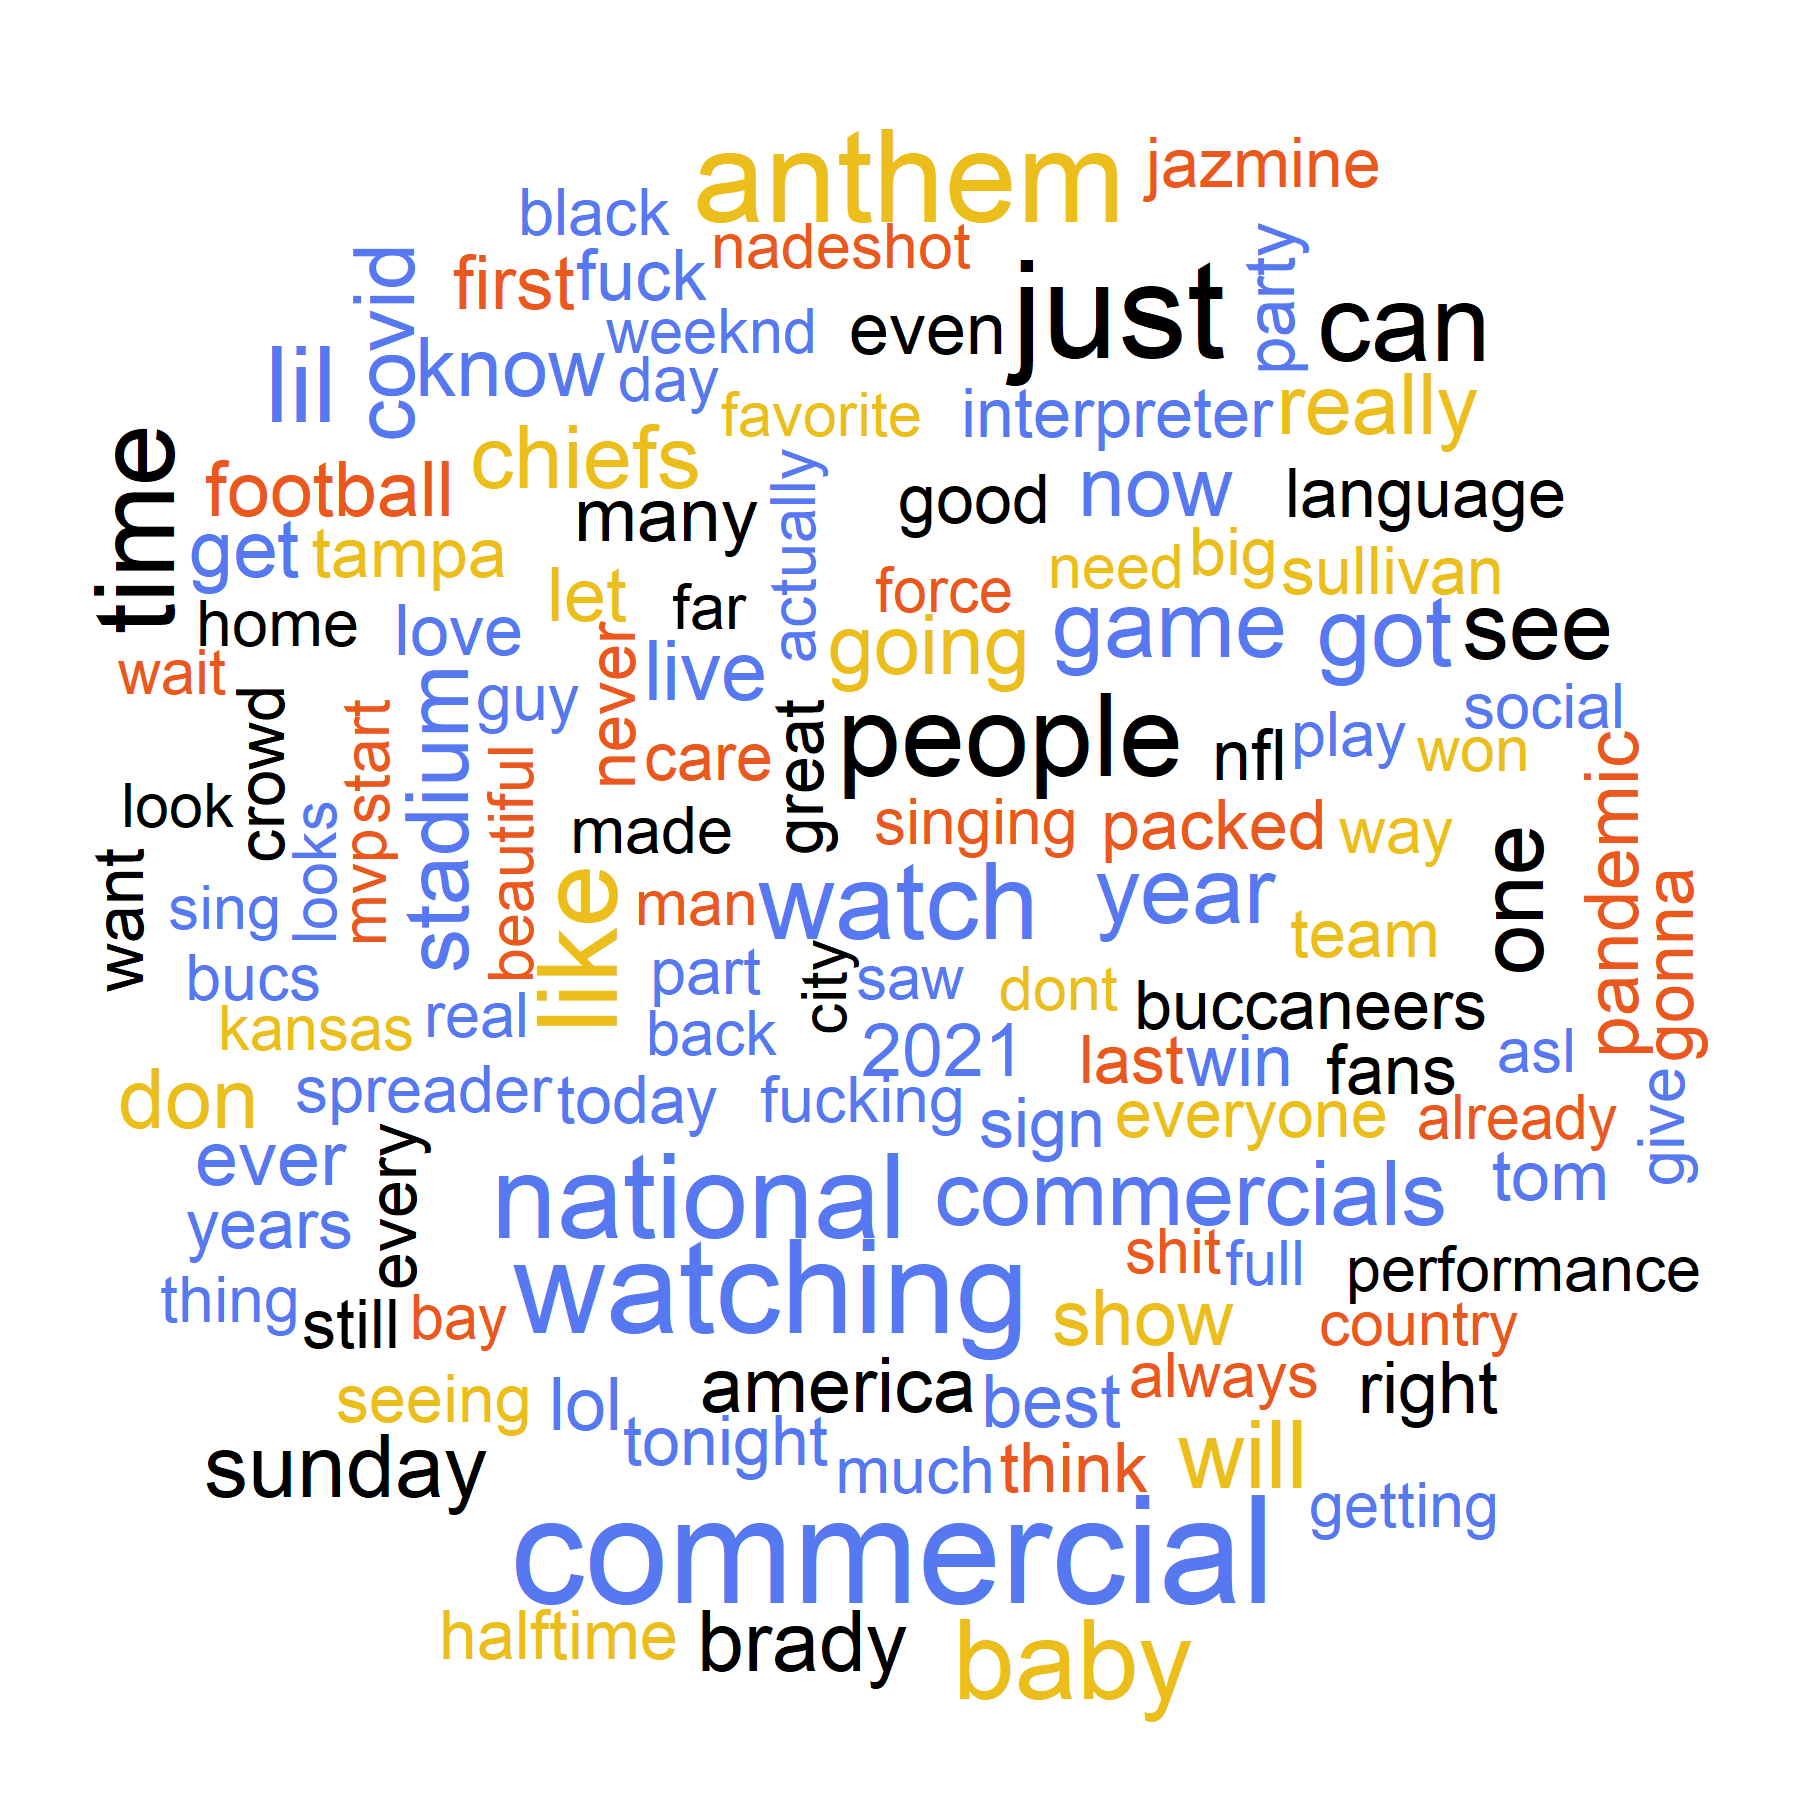
When Tom Brady passed to Gronk for Tampa Bay's first touchdown, Twitter lit up.

Fans inside the stadium cheered as a streaker illegally ran across the field before being tackled by security. Tweets indicate that those watching at home were also entertained by the antics interrupting play.

Regardless of whether the cause of a key moment was a touchdown or a streaker, many of the most frequently used words in tweets are the same. The wordclouds do a great job of showing the most frequent words but do not capture which words are unique to each key moment. Thankfully, TF-IDF (term frequency-inverse document frequency) overcomes the deficiencies of wordclouds although in a less visually pleasing manner. TF-IDF is an intimidating term for a relatively simple concept. It determines the importance of a word to a document in a collection of documents. In our case, a document contains the tweets for a specific key moment and our collection of documents is the 10 key moments we identified. The importance of a word increases with the number of times the word appears in a document (term frequency), but decreases with the number of documents that contain the word (inverse document frequency). Simply stated, words that appear in all the documents are not ranked as important even if they appear many times. For example, the names of teams playing in the Super Bowl are often used in tweets during all the key moments, so they don't mean much to any individual key moment. However, words used often for one particular key moment while not used many times for other key moments are ranked as very important. Those words are relatively distinct to a single moment and capture what is unique about that moment by removing the noise of words common to many moments. The table shows the most important and defining words for each moment. The national anthem was defined by tweets including, 'flyover', 'rockstar', 'spangled', and 'stealth'. Words such as 'marching', 'jockstraps', and 'balloons' indicate what separated tweets during the halftime show from the other moments. Nearing the end of the game, a commercial by Robinhood, recently embroiled in controversy, defined the moment evidenced by the most meaningful words including, 'robinhood', 'audacity', and 'gamestop'. On the topic of commercials, we will explore how Twitter felt about them.
What Were the Best Commercials?
What would a Super Bowl be without its commercials? A recent survey found that of those who watched the Super Bowl, 20% watched just for the ads. This year, advertisers spent on average $5.5 million for a 30 second commercial. To analyze the emotional response to commercials we limited tweets to only those about particular commercials. Then, we used the insightful NRC Emotion Lexicon to relate tweets to eight basic emotions (anger, fear, anticipation, trust, surprise, sadness, joy, and disgust). The previously mentioned commercial from Robinhood elicited a strong response though not the response they probably wanted. Viewers took to Twitter in droves to express their anger, disgust, and surprise at Robinhood's commercial. Jeep's 2-minute long ad, 'The Middle', featuring Bruce Springsteen saddened the most. On the other hand, Cheetos sparked the most joy. Chipotle topped in anticipation and fear. Lastly, Will Ferrell's outrage at Norway's adoption of electric vehicles earned GM the greatest trust.How Did Emotions Change During the Super Bowl?
In this section, we explore how emotions changed over the course of the Super Bowl using the Twitter data. Did tweets about the Chiefs get sadder as they fell behind and ultimately lost the game failing to win a second straight Super Bowl? They sure did. Before the start of the game only 6.8% of tweets about the Chiefs expressed sadness. Once the Bucs took a 7-3 lead this rose to 11.2% and things only got sadder from there. It shouldn't come as a surprise that tweets about the Chiefs also became more angry. Initially, tweets about Kansas City were more joyful than those about Tampa Bay. After the Buccaneers scored their first touchdown, the joyfulness of tweets about them surpassed those about the Chiefs.
Next, we look at geographic location to gauge the emotions of fans of the two teams. Where the fans of the Chiefs and Bucs are located using an interactive map of NFL team popularity.
Initially, tweets about Kansas City were more joyful than those about Tampa Bay. After the Buccaneers scored their first touchdown, the joyfulness of tweets about them surpassed those about the Chiefs.
Next, we look at geographic location to gauge the emotions of fans of the two teams. Where the fans of the Chiefs and Bucs are located using an interactive map of NFL team popularity.
 We break our dataset of tweets into three groups,
- Kansas City Chiefs: Kansas and Missouri
- Tampa Bay Buccaneers: Florida
- New England Patriots: Massachusetts, Vermont, New Hampshire, and Maine